Contract Drafting Analytics for University Boards
If you’ve successfully streamlined your internal approvals, but are tired of manually scrubbing spreadsheets every time the Board of Trustees or the Provost asks for a status update, you’re not alone.
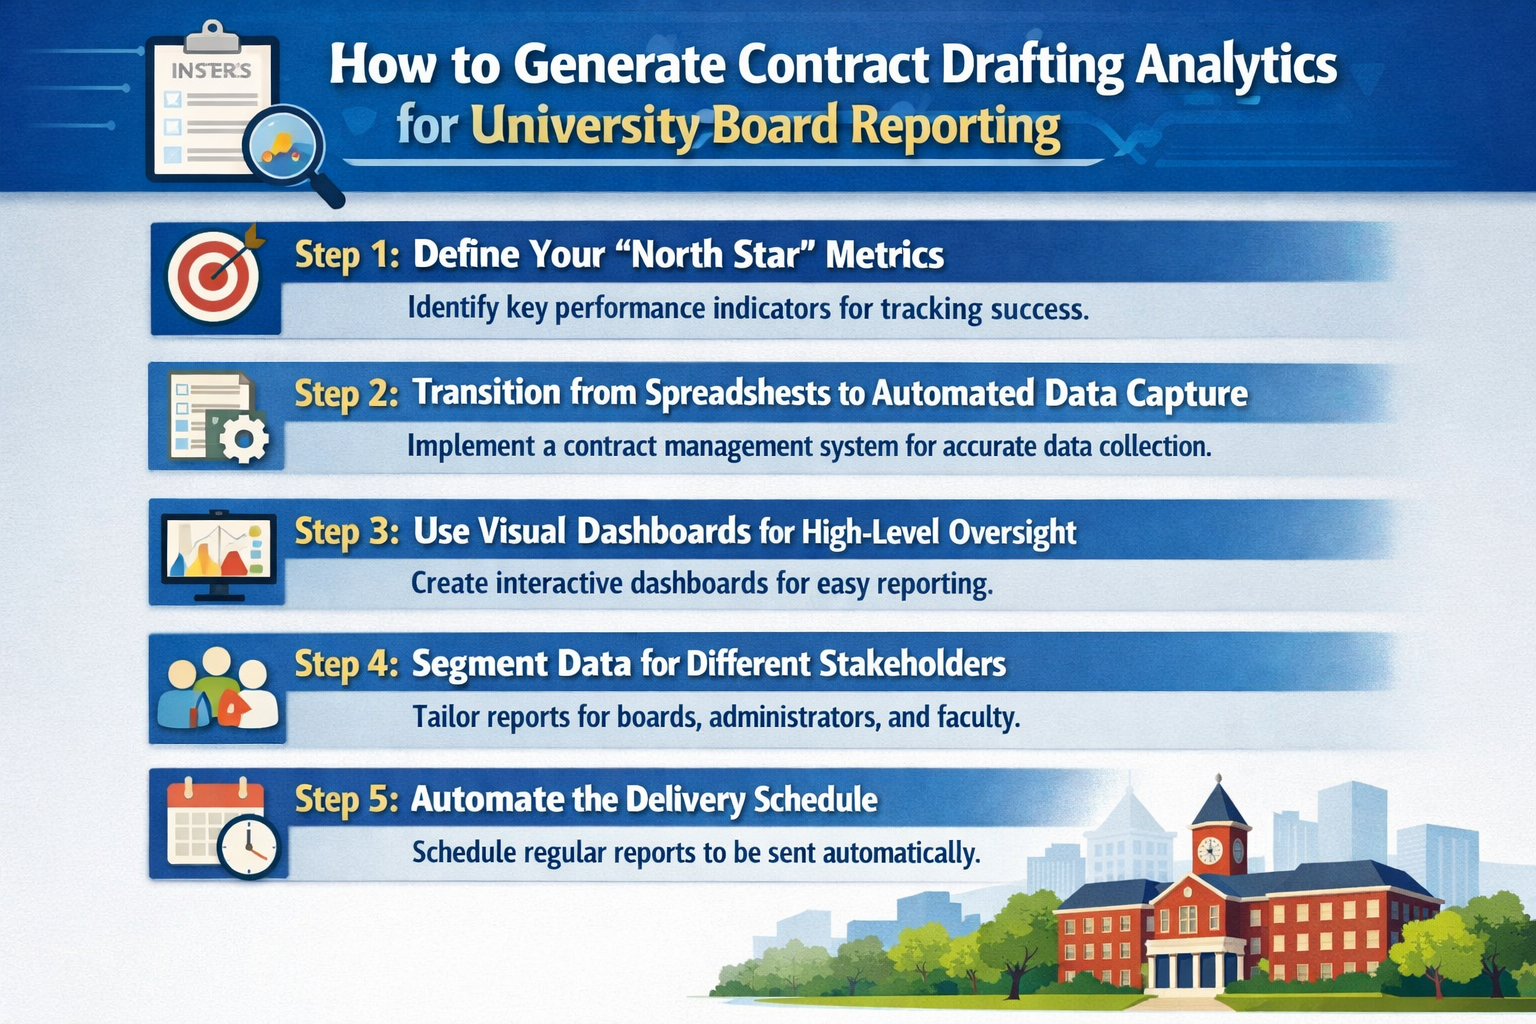
Here are the 5 steps to generating real-time contract drafting analytics for university board reporting:
Step 1: Define Your “North Star” Metrics
To avoid overwhelming the Board with raw data, we recommend focusing on a few key metrics that actually demonstrate the health of your research pipeline.
Consider tracking:
- Cycle Time by Agreement Type: Show the average days from “Draft Created” to “Fully Executed” for SRAs vs. NDAs.
- Volume by Department: Identify which colleges are driving the most research activity to justify resource allocation.
- Clause Deviation Rates: Track how often your “Standard” clauses are being modified to justify updates to your library.
Step 2: Transition from Spreadsheets to Automated Data Capture
The biggest threat to report accuracy is manual entry. We recommend using your contract drafting software as the primary source of truth, where data is captured automatically the moment a drafter selects a template or a PI hits “Approve.”
To ensure data integrity, try to:
- Eliminate Manual Re-Entry: Ensure your drafting tool pulls PI and project metadata directly from your grant management system.
- Tag Milestones Automatically: We suggest setting the system to “date-stamp” every phase so you can see exactly where bottlenecks are occurring without asking for verbal updates.
Step 3: Use Visual Dashboards for High-Level Oversight
Board members rarely want to see a list of hundreds of active contracts. Instead, we recommend using visual dashboards that translate complex legal workflows into easy-to-digest charts.
To make your data scannable, consider:
- Heat Maps: Use a heat map to show where contracts are currently sitting, whether in “Drafting,” “Internal Review,” or “Negotiation.”
- Trend Lines: Show year-over-year growth in research volume to prove your office is scaling alongside the university’s ambitions.
Step 4: Segment Data for Different Stakeholders
Not every report should look the same. We recommend creating “Views” that are tailored to the specific concerns of the Provost, the General Counsel, and the Board.
To tailor your reporting:
- Use the “Risk” View for GC: Focus on indemnity deviations and high-risk IP terms.
- Create an “Economic” View for the Board: Focus on total contract value and the speed at which funds are being “unlocked” for the lab.
- Setup an “Operational” View for OSP Directors: Focus on individual workload balance and turnaround times.
Step 5: Automate the Delivery Schedule
To move from reactive to proactive reporting, we recommend setting your system to automatically push these reports to key stakeholders on a set schedule, whether weekly, monthly, or quarterly.
To stay ahead of the curve:
- Set Automated “Pulse” Reports: We suggest a Monday morning summary for leadership that highlights any contract stalled for more than 10 days.
- Export-Ready Formatting: Ensure your analytics can be exported into a slide-ready format so you aren’t rebuilding charts right before a meeting.
Conclusion
And there you have it!
We hope this has been helpful in showing you how to turn your daily drafting efforts into the strategic insights your university leadership needs.
If you need any help or would like to see what a fully automated reporting dashboard looks like, feel free to book a demo with us!
See it in action
Turn contract chaos into a streamlined workflow
Join legal teams who cut contract turnaround time by 60%. Book a 15-minute demo to see how.