The visual reports area has been rebuilt around a shared frame: consistent chrome across every report, date-range scoping, and the ability to drill from a chart straight into the underlying contract list through a side drawer.
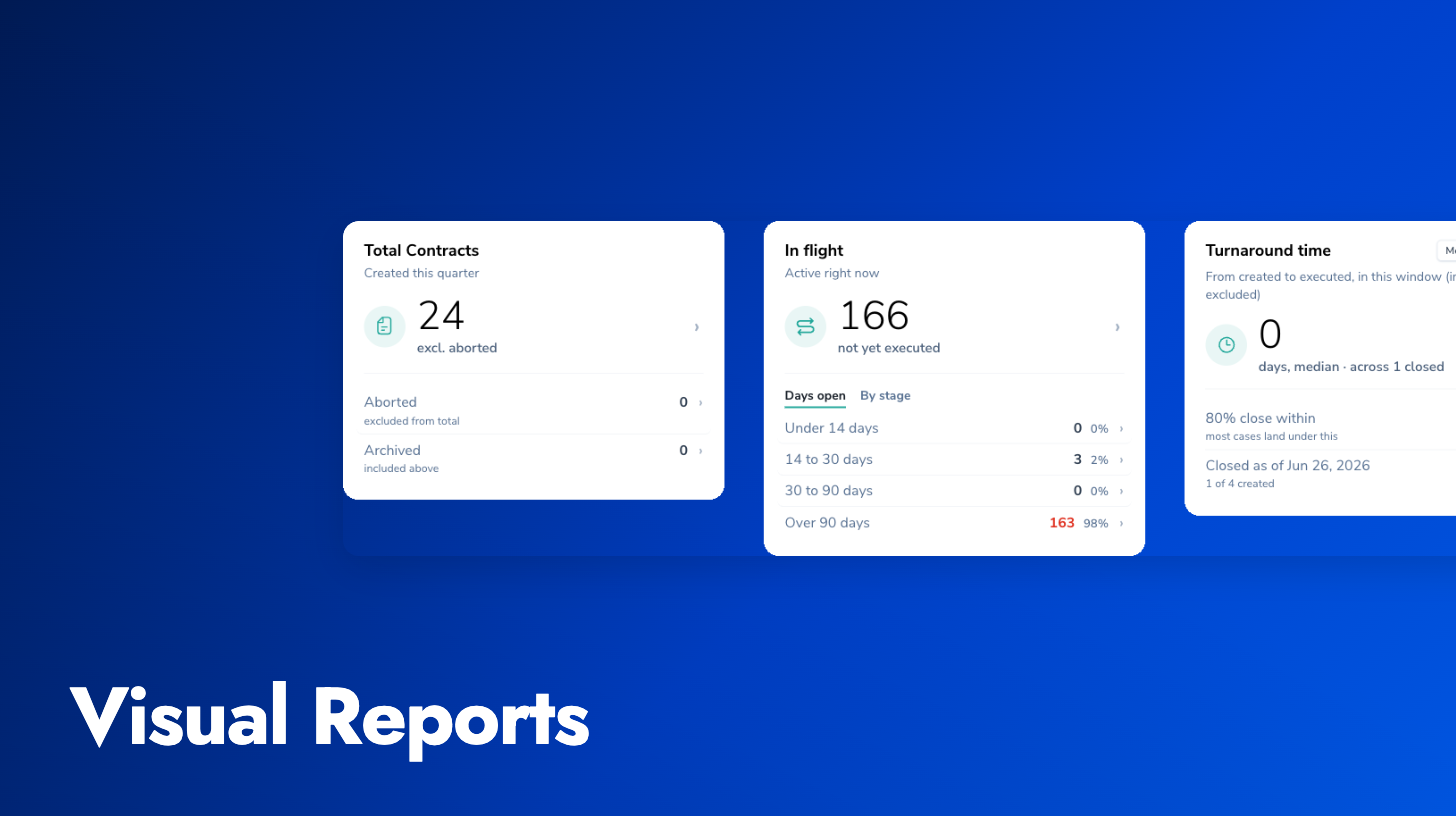
Reworked reports: The Workload report gets a richer in-flight view with stalled buckets and pipeline-over-time. Turnaround now shows medians, a by-type breakdown, negotiation rounds, and an honest funnel. Volume adds configurable leaderboards, owner share-of-total, and breakdowns by custom property with hierarchy drill-down and an inline dimension picker.
Configurable periods: You choose the reporting period and the comparison period, so trends and deltas reflect the window you care about rather than a fixed default.
Per-card visibility: Each visual report can be shared with specific users or roles, defaulting to admin-only, matching the per-report controls already available for data exports. Reports a viewer isn’t entitled to see are hidden, including by direct URL.