Reading the Reports
You open Reports, see a number like “median 46 days,” and the obvious question is: 46 days measured how, from when, over which contracts? The wrong answer leads to the wrong decision, so this article is about reading the figures correctly, not just finding them.
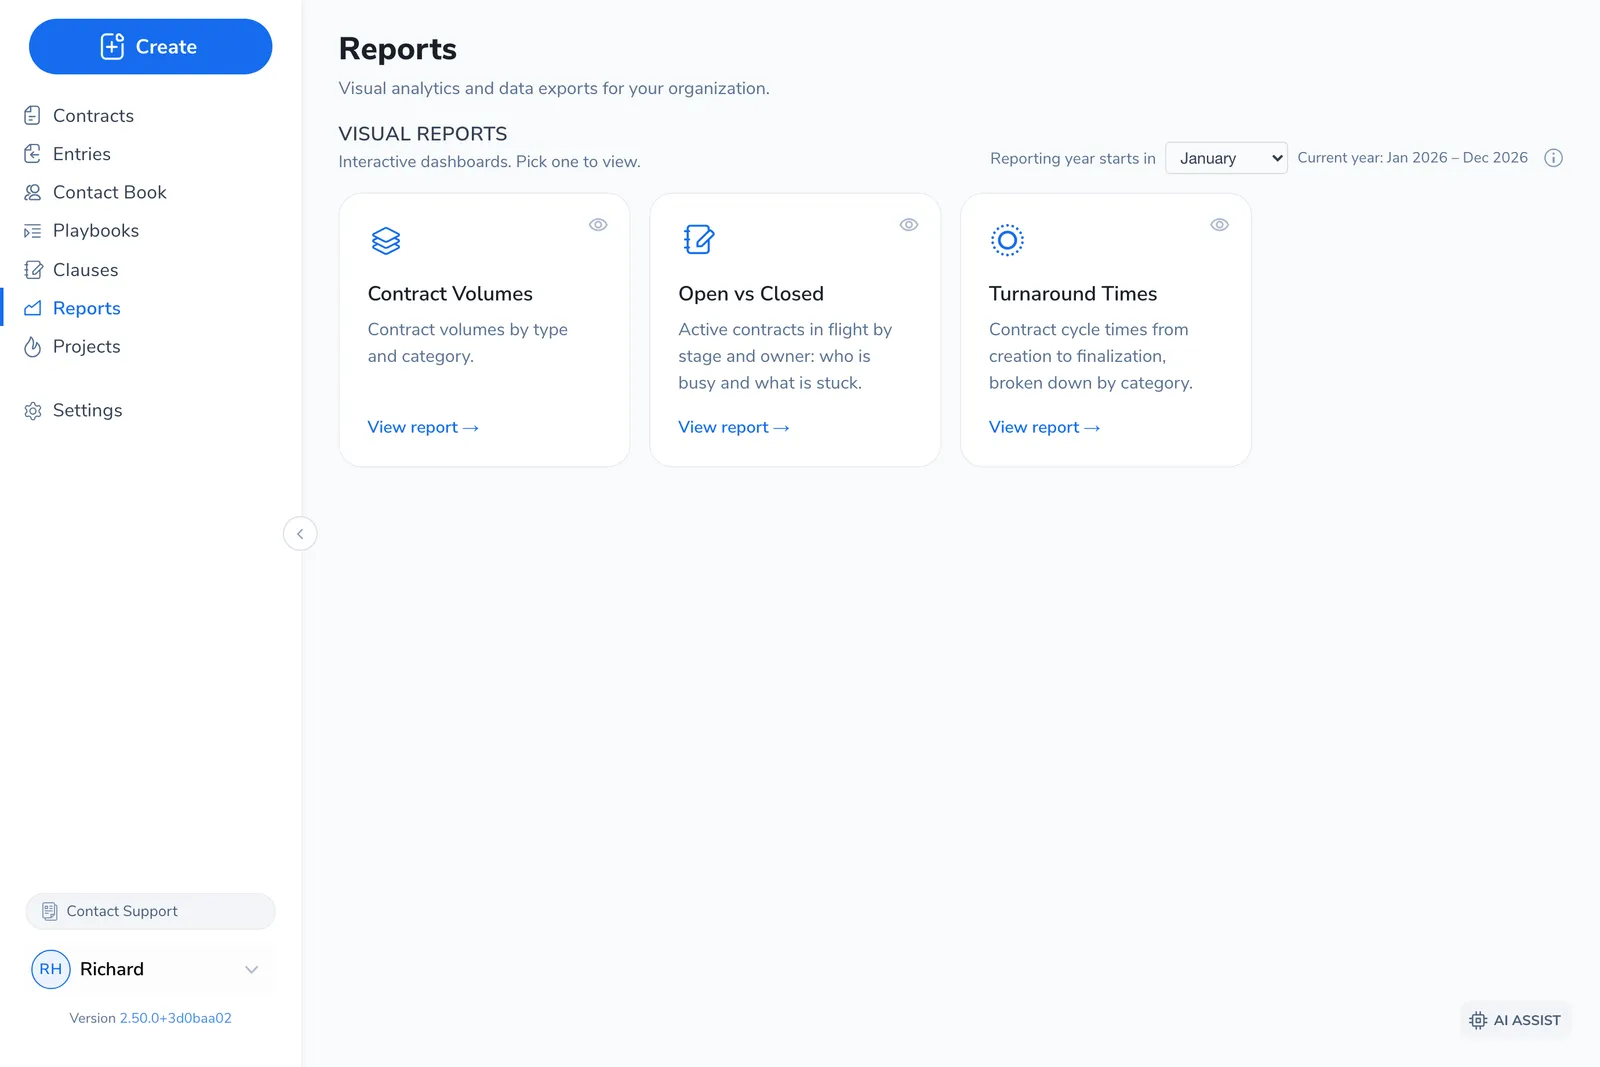
The Reports area (in the left menu, at /reports) has two halves. This article covers the Visual reports half: three interactive cards that count, track, and time your contract work. The other half, downloadable Data exports, has its own article.
The three reports cover three different jobs
Section titled “The three reports cover three different jobs”The cards do not measure the same thing at different angles. They answer three separate questions, each anchored to a different point in time. Confusing them is the most common source of “these numbers don’t match.”
| Card | Question it answers | Anchored to |
|---|---|---|
| Contract Volumes | How much work came in? | The creation date of each contract |
| Open vs Closed | What is in flight right now? | A live snapshot of today |
| Turnaround Times | How long does work take? | The creation date, measured forward to close |
Two of the three are creation cohorts: they select contracts by when they were created, then report on that group. Open vs Closed is the exception. Its headline figures are a snapshot of the present moment, and the date range only narrows its over-time trend.
Contract Volumes
Section titled “Contract Volumes”This card answers how much contract work came in. The headline is Total Contracts created in the window, with a trend arrow against the comparison period.
It always counts by creation date. A contract created in March counts in March, no matter when it was signed.
The scope sentence
Section titled “The scope sentence”The controls read as a sentence: Includes all contracts [created] within [date range], Compared to [period], Also include [Archived / Aborted].
| Control | What it does |
|---|---|
| Completion milestone | The pill after “Includes all contracts” toggles created, created & finalised, or created & executed. “Created” counts everything that entered in the window; the other two narrow to contracts that also reached that close milestone. |
| Date range | The creation window. |
| Compared to | None, the previous period (auto-aligned), or a custom window. Drives the trend arrows. |
| Also include | Archived and Aborted contracts are excluded by default. Tick a chip to fold them back in. |
Reading the breakdowns
Section titled “Reading the breakdowns”- Top People. A leaderboard you can flip between Requesters (who asked for the contract) and Owners (who holds it now), with a Top 5 / Top 10 toggle and an Unassigned row.
- Contract volumes broken down by. Pick the axis: contract type, owner, group (if your workspace uses groups), or any list-type contract property. Properties are ranked by how often they are filled in; sparsely-filled ones sit behind a “rarely-set” expander.
- Split by paper. Any bar can split into Your Template, Counterparty Paper, and Imported so you can see whose paper drove the volume.
Open vs Closed
Section titled “Open vs Closed”This card answers what is in flight right now, and what is stuck. Unlike the other two, its headline figures are a live snapshot of this moment, not a cohort selected by date.
In flight means a contract sitting in one of the four active pipeline stages: Draft, In Negotiation, Pending Approval, or Pending Signature. The card breaks that population down three ways:
- By stage, using your workspace’s own status labels.
- By owner, with an Unassigned row for in-flight work nobody holds.
- By age, in buckets: Under 14 days, 14 to 30 days, 30 to 90 days, and Over 90 days.
Two follow-on panels surface what needs attention: Stalled (in flight beyond a threshold, toggling between 90+ and 180+ days, oldest first) and Unassigned (in-flight work with no owner).
The scope sentence
Section titled “The scope sentence”The controls read: Counts a case as open when it is [created], and closed once [executed].
| Control | Options | Default |
|---|---|---|
| Open when | created, or first assigned (drops never-assigned work and measures flow from the assignment date) | created |
| Closed once | executed, or finalised | executed |
These two pills change where the line between “open” and “closed” sits, which shifts the pipeline trend. A workspace that closes its books at finalisation rather than signature will set “closed once” to finalised, and its numbers will read differently from the defaults.
Turnaround Times
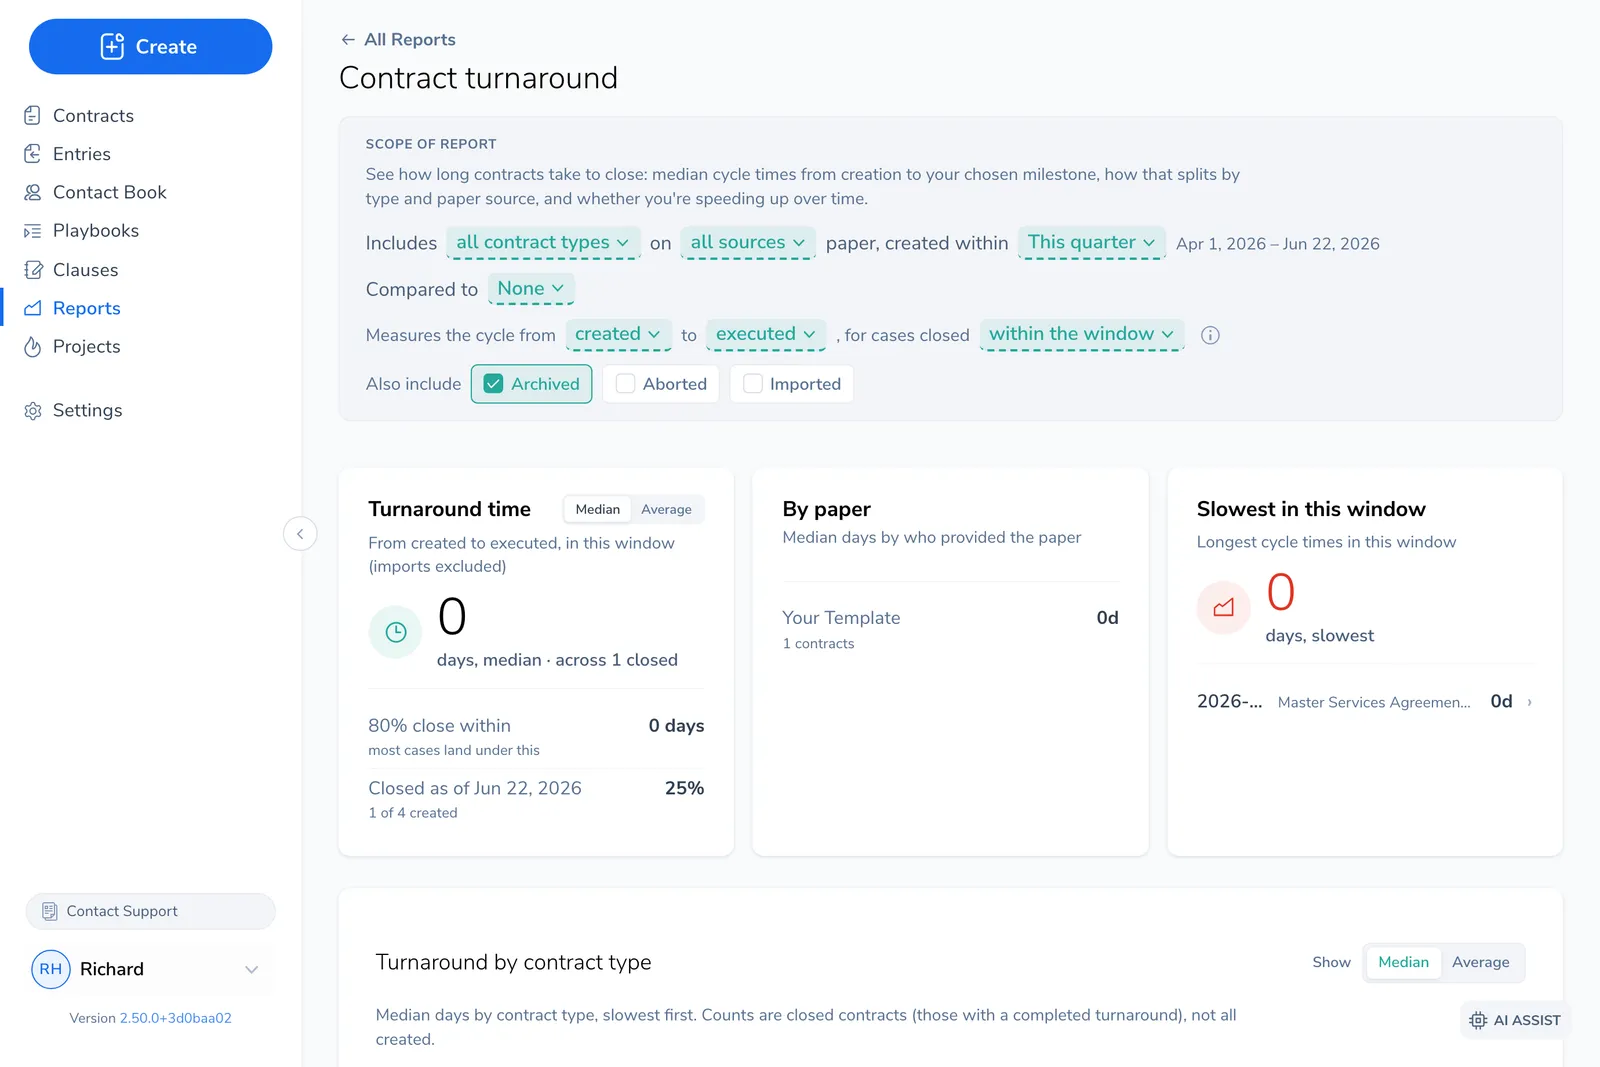
Section titled “Turnaround Times”This card answers how long contracts take to close. It is a created cohort: the window selects contracts created in the period, and the cycle time is measured on those that reached the close milestone.
Median, not average, is the headline
Section titled “Median, not average, is the headline”The headline Turnaround time is a median by default (you can flip it to Average). This is deliberate. Cycle times are heavy-tailed: one contract that drags on for a year would pull a mean far above what a typical contract experiences. The median, the midpoint, is the honest “typical” figure.
Below the headline sit two more figures that matter more than the average:
- 80% close within N days (the p80). Most cases land under this. It is the number to quote when someone asks “how long should I expect this to take, worst case but not freak case.”
- Closed as of [date], the completion rate: of the contracts created in the window, how many have actually closed.
The scope sentence
Section titled “The scope sentence”The controls read: Includes [all contract types] on [all sources] paper, created within [date range], Compared to [period]. Measures the cycle from [created] to [executed], for cases closed [within the window]. Also include [Archived / Aborted / Imported].
| Control | What it does |
|---|---|
| Contract type / paper source | Narrow to one category, or to Your Template / Counterparty Paper / Imported. |
| Start milestone | created or first assigned, the start of the clock. |
| Close milestone | executed or finalised, the end of the clock. |
| Cases closed | within the window (a like-for-like comparison, but undercounts because slow contracts that close later are excluded) or at any point (the true turnaround, but only fair once the period has matured). |
| Also include | Fold Archived, Aborted, or Imported back in. |
The cases closed pill is the subtle one. “Within the window” only counts contracts created and closed in the same period, which is fair for comparing periods but makes turnaround look shorter. “At any point” counts every contract created in the period that has closed by today, which is the real figure but reads artificially fast for a recent period whose slow contracts haven’t closed yet. The card shows a maturity caution when this applies.
The deeper panels
Section titled “The deeper panels”- By contract type and By paper source, each as median / average / p80, slowest first, with a previous-period comparison.
- Slowest in this window, the longest individual cycles, with owner and type.
- Trend, the median by creation period, to see whether you’re speeding up.
- Lifecycle funnel (created to finalised to executed) and Negotiation intensity (median rounds per contract).
When the numbers seem to disagree
Section titled “When the numbers seem to disagree”Most “these don’t add up” questions trace back to the time anchors in the table above: Volume counts everything created, Turnaround only times the ones that have closed, and Open vs Closed is a live snapshot its date range never moves. One more catch is the close milestone: executed and finalised are different moments, and each card sets its own pill independently, so two cards can report different “closes” for the same contract.